
|
Long-term forecasting is more of an art than a science. As none of us can tell the future, we should probably all put our skeptics’ hats on and view any and all forecasts as educated guesses. However, the fact that the future is unknown does not allow us as investors to abstain completely from the process of forecasting. At Anderson Griggs Investments, we believe investors should approach forecasting as a business owner would his or her business, setting goals and then deploying capital to work towards meeting those goals by choosing among the multitude of ways available to allocate their savings, with full understanding that each dollar of capital deployed is at risk. Because of this ever present risk, a systematic process should be in place to review progress, update forecasts, and make changes as needed. Your investment choices are limited to two broad categories. You can own an asset and share in the risk and rewards of that ownership, or you can lend your money in return for an interest payment and a promise to be repaid at some point in the future. Although there are thousands of options on what asset to own or who to lend your money to, we are limiting our discussion today to the three broad indexes of common stocks included in the S&P 1500 Composite, and the interest rates on US Government Treasury Bills, Notes and Bonds. The three indices comprise approximately 90% of the total market capital of publicly traded corporations with headquarters in the United States, while the US Treasury is considered the safest of all fixed income investments available to individual investors. We have been making these forecasts for the past twenty years and have used them to help us determine the basic allocation between common stocks and bonds for accounts. We have chosen a five year time frame for this discussion for two reasons. The first is that we do not believe there are scientific factors which can be isolated and replicated to provide insight into short-term market predictions. However, over a longer period the price of a security (or the total market value of all the securities in a market) will approximate the underlying capital retained and available for earning future income for its owners. Secondly, five years is our average holding period for a security. We will begin by reviewing our forecast of returns as published five years ago. Our Five Year Forecast Created in June, 2011 Annualized Returns including dividends: S&P 500: 11.34% S&P 400: 8.28% S&P 600: 7.27% Market Weights as % of S&P 1500: S&P 500: 87.74% S&P 400: 8.56% S&P 600: 3.70% Daily Treasury Yield Curve Rates as provided by the US Treasury on June 7, 2011: 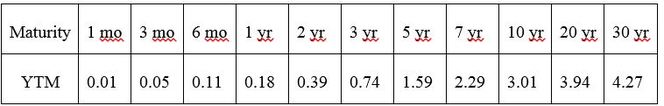 Our conclusion at the time was that the current level of interest rates warranted maintaining the maximum allocation possible to common stocks and overweighting large companies (S&P 500) relative to middle-sized companies (S&P 400) and smaller companies (S&P 600). Although our forecast indicated lower returns than the indexes actually produced over the following five years, the allocation decisions drawn from the forecast were pretty accurate. We could show the index results earned by holding the ETFs less a small fee, but we believe the better choice is to compare the results to the average five year returns of mutual funds. We feel that these results better reflect the returns earned by the average investor. Common Stock Mutual Funds* Large Blend: 10.90% Mid-Cap Blend: 9.37% Small Blend: 8.89% Taxable Bond Funds* Long Term: 6.99% Intermediate Term: 3.30% Short Term: 1.43% *Selected Fund Category Performance: Total Returns provided by Morningstar on 6/7/2016. Returns are simple averages of funds in the Morningstar Database per category as of that date. There are two caveats concerning these past results. Given that we could just choose a time frame where our forecasts seemed superior, disregarding those time frames where things did not work out, you will have to make your judgement as to the results. However, I will repeat that we have used this method with minor adjustments for over 20 years, and it has continued to provide satisfactory results. In addition, it may be that in today’s world of instantaneous reactions to all known events, five years may in fact be too long. So we will rely on the words of John Maynard Keynes, influential economist and successful investor, to help you judge the usefulness of our chosen time frame: “Long run is a misleading guide to current affairs. In the long run we are all dead.” Our Five Year Forecast as of May 31, 2016 Annualized Returns including dividends: S&P 500: 7.68% S&P 400: 7.04% S&P 600: 6.84% Market Weights as % of S&P 1500: S&P 500: 90.91% S&P 400: 6.83% S&P 600: 2.99% Daily Treasury Yield Curve Rates as provided by the US Treasury on June 7, 2016: 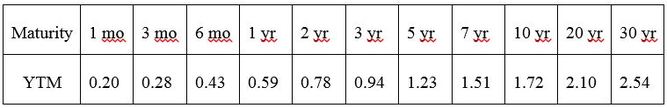 As you can see, our expected rates of return for the next five years are substantially lower than those of five years ago. At the same time, long-term interest rates are also much lower. The composite summaries of our quantitative work follows. As you review them, I would like to highlight a few points. Return on equity (ROE) and dividend yields on the S&P 500 and 400 have been quite stable over the years. This has not been true for the small cap S&P 600. The current projected return (Prj%), because it is a function of current prices, is in the lowest decile we have produced over the years. This should be easy to understand in that the price is set by the day to day emotions of buyers and sellers. S&P 500 (SPY) 5-Year Estimated Earnings, Dividends and Projected Returns* 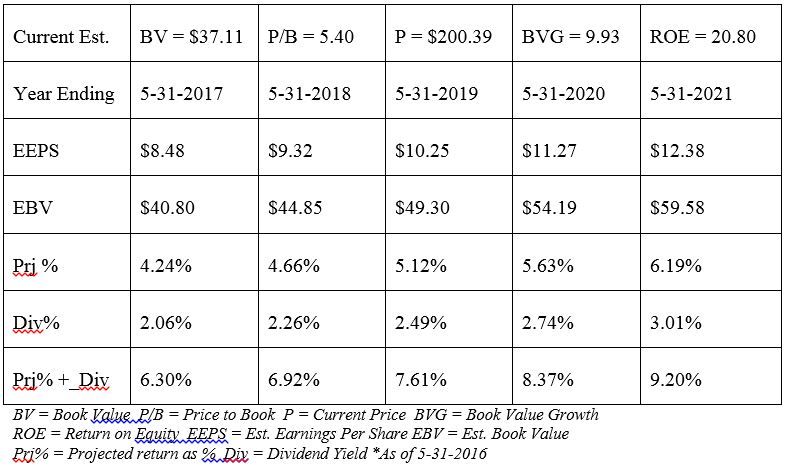 S&P 400 (MDY) 5-Year Estimated Earnings, Dividends and Projected Returns* 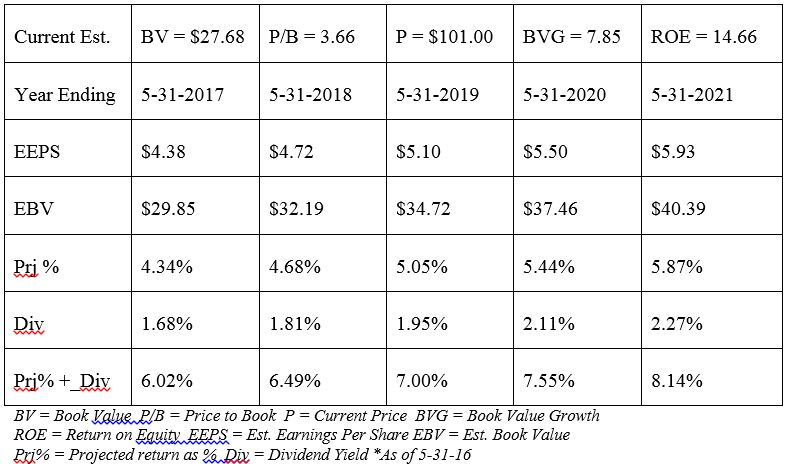 S&P 600 (IJR) 5-Year Estimated Earnings, Dividends and Projected Returns* 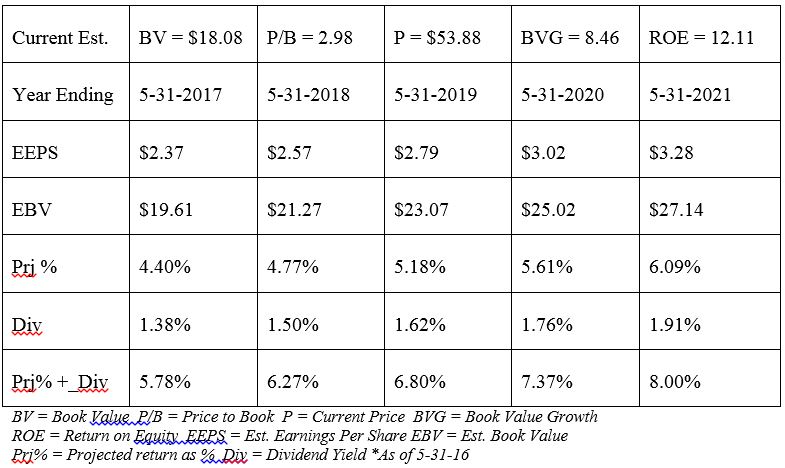 Conclusion
As we stated, we use these forecasts to help us determine the basic allocation between common stocks and bonds. That doesn’t mean we automatically defer to our projections. Today we have some concerns that modify the application of these projections. The two items that we believe will drive returns over the coming five years are interest rates and corporate earnings. This should be of no surprise since it is a concern voiced by just about every Chief Investment Officer in the nation. Market prices are high today relative to our findings over the years, and this is because interest rates are the lowest they have been since the beginning of the world’s bond markets. Without the opportunity to earn a respectable rate of return from the certainty of US Government bonds, people have moved more of their investment capital into common stocks in an attempt to earn enough to reach their goals. Needless to say, if interest rates rise in the coming five years, it will be reflected in lower relative prices of common stocks. In addition, any rise in US Treasury rates could be devastating to the market value of all bonds worldwide. There is some hope for corporate earnings. Earnings of financials which represent 15% of the markets’ total capital should increase from a rise in interest rates. Technology, at 22% of market capitalization, should have rising earnings from the move towards automation and cost controls. Health Care, at 13%, will continue to benefit from the aging of the world’s populations, while energy, at 7%, should have an earnings recovery over the coming year or two. Together these four sectors represent more than 50% of the markets’ earnings, all of which could increase at a rapid enough pace to offset any short-term rise in interest rates. Given these concerns, we do not see any reason conservative investors should be investing in bonds at the current prices. As for common stocks, we believe an overweight position is no longer warranted, and individuals should maintain a larger than normal cash reserve. Opportunities will always become available as the future unfolds, and having cash will allow one to take advantage of these opportunities. In addition, because interest rates are so low, the price (loss of interest income) is almost nil for holding funds in reserve. Until next time, Kendall J. Anderson, CFA Comments are closed.
|

Kendall J. Anderson, CFA, Founder

Justin T. Anderson, President
Categories
All
Archives
April 2024
|
 RSS Feed
|
Common Sense Investment Management for Intelligent Investors
|