
|
The vast majority of businesses manage their operations according to a plan. That plan may be as simple as an entrepreneur writing down a few goals on a napkin, or as complex as a massive set of instructions covering the day to day, month to month, year by year, or decade by decade actions required to maximize profits. However complex the plan may be, it will guide the business’s use of its capital for future growth. This entire process is dependent upon the extremely difficult practice of forecasting. As individuals, it is a good idea to treat the savings you’ve put aside for future use as a business would. You choose a goal for those funds, and then make plans based on assumptions of the future. When working towards maximization of profits, businesses realize there are certain areas in which they lack the knowledge and training required to meet that goal, so they outsource those portions to other professionals. Our firm is fortunate in that there are so many individuals and organizations who have been willing to outsource to us the expertise required to help meet their personal financial goals. Part of that process requires us to create forecasts, even though we know how hard and subject to error any forecast can be. In an attempt to combat the wide margins of error and the false hope any single forecast can create, we recalculate our forecasts monthly. We update the ever changing data, revisit previous data, and make changes when we believe it is necessary. One goal of our forecast is to help us lessen three major areas of risk: market risk, individual security risk, and behavior risk. And it is fairly good at helping us identify and control for market risk and individual security risk. The quantitative approach involves known numbers, and over time those numbers add to a semi-stable set of data that can help us decide if we are being offered bargains or are being overcharged for our investments. We would obviously prefer to buy low and sell high. Buying low at times can be difficult, though, and if there are no bargains available, we would much rather wait for better opportunities. Our forecast is not able to easily deal with behavior risk, however, and by that we mean the bad investment behavior that we are all subject to: buying and selling based on our emotions. The marketplace as a whole is ruled violently by the greed and fear of its market participants. Most people end up buying high and selling low. To do the opposite, to do what we preach, takes substantial amounts of personal strength. Although our forecast cannot predict the future whimsy of the masses, it offers us a fundamental common sense base from which we can combat our poor behavioral urges. The main purpose of this forecast is to guide us in allocating our investments between common stocks, with their higher level of risk, and US Government issued bills, notes, bonds, and/or FDIC insured certificates of deposits. Government obligations and FDIC insured certificates are as close as we can get to a simple, easy to understand, low risk investment. By comparing our estimate of the potential return of stocks to the known returns of these relatively risk free investments, we can quantify the potential increase in return for taking a higher level of risk. In that our projections are forward looking, and are calculated without any attempt to quantify the behavior of market participants, actual results will, without a doubt, be different than those stated here. However, they will sufficiently provide guidance. Before we share our current forecast, we thought it would be appropriate to revisit our prior five year forecast, created on May 4, 2012 for the month ending April 30, 2012. Reviewing a prior forecast with actual results is helpful in determining if the work required to create the forecast was just an exercise in futility, or whether it provided some beneficial payoff. Our Conclusion on May 4, 2012 Since the March 2009 lows, the S&P 500 has gained 98% excluding dividends. This three year recovery has been exceeded only once before in 1932-1933. Does this mean that future advances are less likely to happen? Not necessarily. In fact, the gains over the last three years took place without the benefit of individual investors. We believe it is very possible that individuals will once again embrace the benefits of common stock ownership and drive the averages higher. To reinforce this, the market’s recovery in the 1930s lasted until 1937. Following the 25% decline in October 1987, the market entered one of the greatest bull markets in history, lasting thirteen years. And as the above history shows, markets continued to produce solid returns for at least five years after a severe market decline. Even though market averages have increased rapidly since the March 2009 low, corporate profits have kept pace raising the potential return over the next five years slightly above the average returns that US stock markets have experienced throughout history. For most individual investors, the primary question is how much of my investable funds should I expose to common stocks (or some other form of equity ownership) versus lending my funds and being paid an interest payment for their use? Given our quantitative work combined with history and the current level of interest rates, it would seem logical to maintain a commitment to common stocks. Our Estimates from May 4, 2012 S&P 500 5-Year Estimated Earnings, Dividends and Projected Returns as of 4-30-2012 Current Estimates: BV = $29.69, P/B = 3.63, P = $107.81, BVG = 11.84, ROE = 21.80 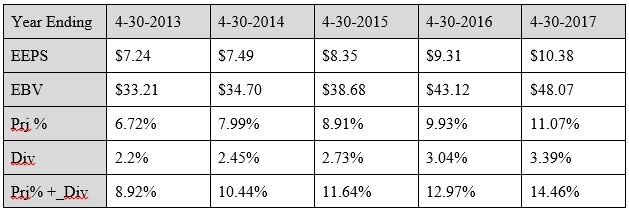 BV = Book Value; P/B = Price to Book; P = Current Price; BVG = Book Value Growth ROE = Return on Equity; EEPS = Est. Earnings Per Share; EBV = Est. Book Value Prj% = Projected return as %; Div = Dividend Yield Expected five year compounded return with dividends from 4-30-2012: 11.28% S&P 500 Index level ending 4-30-2012: 1369.10 S&P 500 Projected Index level ending five years from 4-30-2012: 2059.01 Daily Treasury Yield Curve Rates as provided by the U.S. Treasury on 4-30-2012 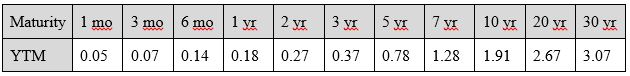 The Actual Results Five Year Compounded Rate of Return for the S&P 500 through April 30, 2017: 13.52% S&P 500 Index level ending 4-30-2017: 2384.20 And now, we’ll share our current five year forecast with you. Our Five Year Forecast for the S&P 500 from April 30, 2017 5-Year Estimated Earnings, Dividends and Projected Returns as of 4-30-2017 Current Estimates: BV = $40.89, P/B = 5.86, P = $239.58, BVG = 9.57, ROE = 20.28 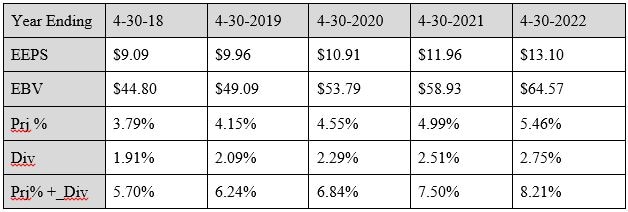 BV = Book Value P/B = Price to Book P = Current Price BVG = Book Value Growth ROE = Return on Equity EEPS = Est. Earnings Per Share EBV = Est. Book Value Prj% = Projected return as % Div = Dividend Yield Expected five year compounded return with dividends from 4-30-2017: 6.89% S&P 500 Index level ending 4-30-2017: 2384.20 S&P Projected Index level ending 4-30-2022: 2983.44 Daily Treasury Yield Curve Rates as provided by the U.S. Treasury on 4-30-2017 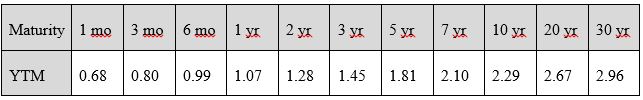 Conclusion As we mentioned earlier, our purpose with these forecasts is to guide our allocation of investment capital between risky common stocks and the relatively risk free returns available from US Government obligations and their cousins, FDIC insured certificates. If our projections are completely accurate and no other changes are to take place, our conclusion would be simple – stay the course and maintain an overweight in common stocks. We could expect to receive dividends of 1.91% per year and growth of capital of 3.79% per year. For a taxable account, this would generate a return of 4.845% after federal income tax (the preferential tax treatment for dividends and capital gains of 15% tax would cover the majority of investors). The after tax return of a 5 year Treasury note (with a 28% tax rate on ordinary income) would produce an income of just 1.30%.
But all things are not equal in today’s valuations. First, the 12 month earnings yield of 3.79% is one of the lowest expected returns we have calculated since we began making these forecasts over twenty years ago. The average has been close to double this figure. To meet our expectations over the next five years would require a constant growth rate that is questionable. Second, there has never been a period during our professional career where relatively risk free interest rates stayed near zero for such an extended period of time. It is therefore important that we recognize this in our suggested allocation. For a conservative investor, our normal weight is 60% stocks and 40% fixed income. For the last eight years we have recommended an allocation of 75% common stocks and 25% fixed income or equivalents. Today, given the historically low expected returns from both common stocks and bonds, we believe it is prudent for a conservative investor to have no more than 60% in common stocks, and depending on the investor’s personal situation, even less could be appropriate. Even for a more aggressive investor whose normal allocation to common stocks is near 100%, some cash or cash equivalent is recommended, preferably 20% or more. In addition, we believe that earning a higher than projected return will only be possible with superior security selection. We will do our best to provide both our conservative and more aggressive clients with a respectable rate of return under the current environment, with the hope that something will soon change that will make our job and the returns you require easier to obtain. Until next time, Kendall J. Anderson, CFA Comments are closed.
|

Kendall J. Anderson, CFA, Founder

Justin T. Anderson, President
Categories
All
Archives
April 2024
|
 RSS Feed
|
Common Sense Investment Management for Intelligent Investors
|