
|
Executive Summary & Methodology We believe that predicting short term swings in the market is an exercise in humility. Longer-term market predictions can have some value, but they should be based on a form of valuation methodology of the underlying securities which make up the market of choice, and a consideration of the current mood of the market participants should also be included. We don’t believe there are scientific factors which can be isolated and replicated to provide insight into short-term market predictions. However, we do know that over longer periods of time, the price of a security or the total market value of all the securities in a market will approximate the underlying capital retained and available for earning future income for its owners. This may not make much sense, so I’ll illustrate with an example. Wal-Mart is the world’s largest retailer. Most of us know the story of Sam Walton and his creation, Wal-Mart, in 1962. In 1970, the company issued stock for the first time and raised $3,400,000. If the market never recognized the value of capital growth over time, then Wal-Mart would only be valued for $3,400,000 instead of the $238 billion that it is today. With that in mind it’s easier to understand how our approach to predicting market returns is based primarily on the analysis of current capital and the return potential of that capital,with only a stab at predicting the current mood of investors. The tables in Appendix A and B may look confusing to you, but it gives us a basis for a projection of both the level of the market five years into the future as well as of the expected returns, in the form of dividends and growth of capital over time. Beware of taking this at face value, however.Our methods are based on a statistical model which does not take into consideration human emotions, the primary driver of short-term market prices, both at the market level and at the individual stock level. These valuations will not mirror others because our calculation methods are based on a proprietary weighting method. The tables do not factor in any changes yet to occur which may affect prices or emotions. Given these caveats our projections would indicate the following: Our calculated return potential for holding the S&P 500, S&P 400 and S&P 600 ending five years from 2-4-13 are: S&P 500: 10.60% S&P 400: 7.40% S&P 600: 7.22% Given the estimated returns as calculated, we are overweighing larger companies. We update our projections weekly. We not only complete this work for the S&P 500, S&P 400 and the S&P 600, but we also calculate an estimated return potential for each major industry sector. The constituents of each sector are companies that are currently included in the S&P 500 and whose industry is assigned by Standard & Poors. Our calculated return potential for each sector ending five years from 2-4-13 are: Consumer Discretion: 7.22% Industrials: 9.19% Consumer Staples: 9.56% Materials: 10.07% Energy: 12.38% Technology: 12.60% Financials: 7.68% Utilities: 12.60% Health Care: 12.46% It is time consuming and takes Justin two full days simply to run the quantitative models. But what is more important to you is that these models are used as a guide in the overall direction of your portfolio. We use these numbers to compare one alternative to all other alternatives, and this is the real value of the work. Every day the market offers us a choice of where we can invest. By producing a quantitative study based on sound theory, a choice as to where to deploy our funds can be made on an apple-to-apple comparison. What about emotions? Emotions are, and will continue to be, the drivers of short-term demand for stocks and bonds. At the individual stock level we believe we can isolate certain human traits which drive this demand. However, at the broader market levels, we believe that markets regress to the mean, and judging emotions is more intuitive than quantitative. In other words, it pays to be somewhat of a contrarian and to try not to become a member of the Buy High/Sell Low Club. Over the next twelve months we believe that history will be a helpful guide to understanding “regression to the mean” and the emotions that have driven previous investor buying decisions after other market declines. 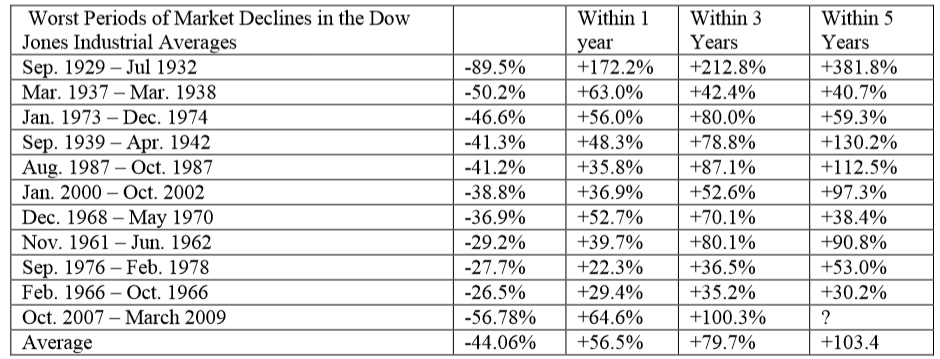 Courtesy of Zacks Research & Yahoo Finance
Since the March 2009 lows, the S&P 500 has gained 122.3%. Although this seems extraordinary, the recovery is well within reason when we look at the history of bear markets. The recovery in the past three years is the second best recorded. However, this recovery followed the second worst bear market in the past 100 years. The worst period, from September 1929 through July of 1932, was followed by a recover that recorded a gain of over 380% in the five years following the lows. Believing that the market will not go up because it has gone up so much since the 2009 low should not have any impact over the next twelve months. The rapid increase in prices is reflected in our calculation, and as such, the potential return over the next five years is close to the normal returns that US stock markets have experienced over many years. Given our quantitative work combined with history and a regression to the mean, it would seem logical to maintain a commitment to common stocks relative to alternatives in the market place. For those of you who are number crunchers who would like to speak with us in more detail about our quantitative work, by all means give us a call. Until next time, Kendall J. Anderson, CFA For more detailed information, please contact us at [email protected] for a copy of Appendix A: S&P 500 – S&P 400 – S&P 600 and Appendix B: Sectors. Comments are closed.
|

Kendall J. Anderson, CFA, Founder

Justin T. Anderson, President
Categories
All
Archives
April 2024
|
 RSS Feed
|
Common Sense Investment Management for Intelligent Investors
|